Microsoft System Integration ROI: Measuring Business Impact
The ROI of a Microsoft system integration is measurable, but only if you measure the right things. It is not an abstract efficiency number; it is the sum of manual work eliminated, cycle times shortened, infrastructure retired, and rework avoided. Those are countable. The honest caveat is that integration ROI is back-loaded: the cost is largely up front and the return compounds as the integrated systems remove friction month after month. i3solutions has delivered integrations where the impact is concrete, including one that processed work about 40 percent faster while retaining roughly 90 percent of historical data.
When a VP of IT has to justify an integration program to a finance committee, the weak version of the case talks about process improvement and productivity gains, and the committee discounts it because it cannot be checked. The strong version names the specific levers integration pulls and attaches a number to each. There are four that hold up under scrutiny.
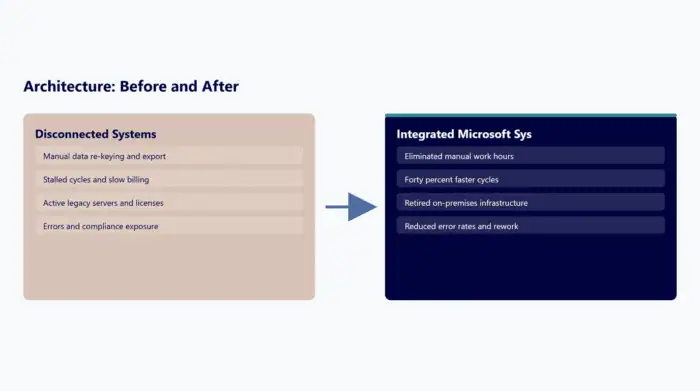
Manual work eliminated. Before integration, people move data between systems by hand: re-keying, exporting and importing, reconciling two sources that should agree. That labor is countable. Estimate the hours spent moving and reconciling data across the systems in scope, and the integration that removes that work returns those hours directly. This is usually the largest and most defensible line in the case because it is a headcount-equivalent number, not a guess.
Cycle time shortened. Integrated systems remove the waiting that disconnected ones create, where a process stalls because data has not yet been carried from one system to the next. Faster cycles have real value: faster billing, faster onboarding, faster reporting. On a legacy integration for a commercial real-estate operator, i3solutions made processing about 40 percent faster while retaining roughly 90 percent of the historical data through the transition, and that speed is not cosmetic, it is capacity the business did not have before.
Infrastructure retired. Integration and modernization frequently let you turn off something old: a legacy server, a redundant license, a maintenance contract for a system the integration makes unnecessary. This is the cleanest line in the whole case because it is a direct, recurring cost that stops. On a federal modernization, the move retired on-premises infrastructure worth about $500,000 a year, a number a finance committee can verify against actual invoices.
Rework and error avoided. Manual data movement produces errors, and errors produce rework and sometimes compliance exposure. Integration with governed, consistent data reduces that error rate. This one is harder to quantify precisely, so use it as a supporting argument rather than the headline, but do not omit it, because in a regulated context the avoided-error value can be the largest line of all even when it is the hardest to pin down.
The honest part of the case is the timing. Integration ROI is back-loaded. The cost lands up front, in the build, and the return accrues afterward as the integrated systems remove friction every month they run. That shape is exactly why integration gets cut in favor of things with faster, smaller, more visible payback, and exactly why the strong business case shows the compounding curve rather than a first-quarter number. The committee that funds integration is funding a return that grows; the case has to make that growth visible.
What the compounding looks like in practice is the proof. That integration’s speed gain is not a one-time event, it repeats on every cycle thereafter. The federal infrastructure savings recur every year the old systems stay off. The professional services firm’s automated provisioning across systems for 125,000 users removes manual identity work continuously, not once. In each case the up-front cost bought a return that keeps paying, which is the actual shape of integration value and the thing a credible ROI case is built to show.
Key Takeaways
- Integration ROI is measurable through four concrete levers: manual work eliminated, cycle time shortened, infrastructure retired, and rework avoided.
- Manual work eliminated is usually the largest and most defensible line because it is a headcount-equivalent number.
- Infrastructure retired is the cleanest line, a direct recurring cost that stops (one modernization retired ~$500K/yr).
- Cycle-time gains are capacity, not cosmetics (one integration ran ~40% faster while keeping ~90% of historical data).
- Integration ROI is back-loaded and compounding; the credible case shows the growing curve, not a first-quarter number.
Frequently Asked Questions
How do you measure the ROI of a system integration?
Through countable levers: hours of manual data movement eliminated, cycle time shortened, legacy infrastructure retired, and rework or errors avoided. Avoid abstract efficiency claims a committee cannot verify.
Which ROI lever is most defensible?
Manual work eliminated, because it converts to a headcount-equivalent number. Estimate the hours people spend moving and reconciling data across the systems in scope; the integration returns those hours.
What is the cleanest cost saving?
Infrastructure retired. When integration or modernization lets you turn off a legacy server, license, or maintenance contract, that is a direct recurring cost that stops, verifiable against invoices. One modernization retired about $500K a year.
Why does integration get cut despite good ROI?
Because the return is back-loaded. The cost is up front and the payoff compounds afterward, so it loses to projects with faster, smaller, more visible payback. The fix is a business case that shows the compounding curve.
What does a real integration outcome look like?
Concrete and recurring. One integration for a commercial real-estate operator processed work about 40% faster while retaining roughly 90% of historical data, and that speed repeats on every cycle, not once.
If you have to justify an integration program, the strongest case is built from your own numbers: the hours your people spend moving data by hand, the cycle times that drag, and the legacy infrastructure you could retire. Bring those and we will help you build the ROI model, including the compounding curve that shows a finance committee why the return grows rather than arriving all at once.
About the Author
Michael Branson is Founder and COO, i3solutions. Connect with him on LinkedIn.