
By Matt Lawson, Senior Consultant, i3solutions. Matt Lawson has spent more than 14 years at i3solutions guiding complex enterprise technology work from scope and system design through development, acceptance, and long-term support, with expertise spanning technical oversight, solution architecture, SharePoint and Microsoft 365 delivery, Power Platform implementation, business intelligence, enterprise search, and the practical application of AI to real business and operational challenges.
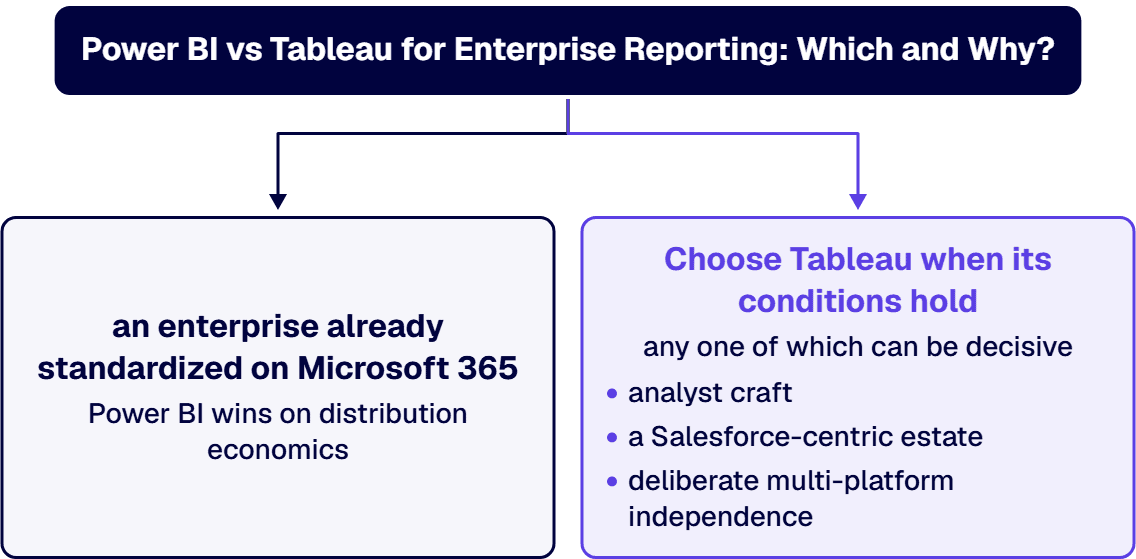
For an enterprise already standardized on Microsoft 365, Power BI wins on distribution economics: Power BI Pro is $14.00 per user per month against $42.00 for a Tableau Explorer and $15.00 for a Tableau Viewer, and once report consumption moves onto a Microsoft Fabric F64 capacity, roughly $8,410 per month pay-as-you-go, viewers stop needing paid per-user licenses at all. Choose Tableau when its conditions hold: analyst teams whose craft is the product itself, a Salesforce-centric application estate, or a mature multi-platform BI practice already built around Tableau Creator at $75.00 per user per month.
That is the verdict in two sentences. The rest of this page shows the license math at enterprise headcounts, the governance and integration differences that matter to regulated organizations, and the specific situations where Tableau remains the right call, because a comparison you can defend to a CFO has to be honest about both columns. It reflects what we see running business intelligence and reporting engagements inside Microsoft-centric enterprises.
Both vendors publish per-user list prices, so the comparison is checkable. On Microsoft’s Power BI pricing page, Pro is $14.00 per user per month and Premium Per User is $24.00, both paid yearly. On Tableau’s pricing page, the Cloud Standard edition lists Creator at $75.00, Explorer at $42.00, and Viewer at $15.00 per user per month billed annually, and the Enterprise edition, which most large regulated deployments end up needing for its management and security features, lists at $115.00, $70.00, and $35.00.
The line that decides enterprise deals is the last one. At 3,000 viewers, Tableau Cloud Enterprise viewer licensing alone is $105,000 per month. Power BI Pro for the same population is $42,000 per month, and a Fabric F64 capacity at roughly $8,410 per month pay-as-you-go, less on a one-year reservation, per Microsoft’s Fabric pricing, removes the viewer licenses entirely: only the authors still pay per user. No plausible Tableau configuration reaches that consumption price at Microsoft-enterprise headcounts, which is why the wider the audience, the harder the economics tilt toward Power BI. The same threshold decides a smaller estate: Power BI licensing at 1,000 users works through where F64 capacity overtakes per user Pro seats at that headcount.
Distribution and identity. Power BI reports live where your users already work: embedded in Teams channels, pinned in SharePoint pages, exported through Excel with live connections, and secured by the same Entra ID accounts, conditional access policies, and Purview sensitivity labels that govern the rest of the tenant. There is no second identity system to audit and no separate sharing model to explain to a regulator. For organizations that report to examiners, the fact that a confidential dashboard inherits the same label and the same access review as the SharePoint site next to it is a control argument, not just a convenience.
The platform argument has also changed shape since the classic Power BI versus Tableau debates: Power BI is now the consumption layer of Microsoft Fabric, reading Delta tables in OneLake directly through Direct Lake mode without import refreshes. The reporting tool decision is increasingly a data platform decision, which is why we treat it alongside the warehouse and lakehouse choice in our Fabric vs Databricks vs Synapse analysis and our Fabric vs Snowflake comparison.
Three conditions, any one of which can be decisive. First, analyst craft: organizations with dedicated visualization teams who have spent years in Tableau produce their best work there, and the switching cost of retraining that team and rebuilding hundreds of curated workbooks is real money that a license delta may never repay. Second, a Salesforce-centric estate: Tableau is a Salesforce company, and shops whose operational core is Salesforce rather than Dynamics or Microsoft 365 will find the native integration pull runs the other way. Third, deliberate multi-platform independence: an enterprise that keeps its BI layer vendor-neutral across clouds may accept Tableau’s premium as the price of that neutrality.
What we counsel against is running both indefinitely without a boundary. Two BI platforms means two semantic models for the same numbers, and sooner or later two versions of the truth in front of two executives. If both exist, one platform should own governed enterprise reporting and the other should have a named, bounded constituency and a review date.
Whichever product wins, the tool is the smaller half of the decision. Executives trust a report because the numbers reconcile, the refresh is monitored, access is reviewed, and a change to a measure goes through review before it reaches a board pack, none of which a license buys. That is design work: a certified semantic model, a workspace and deployment pipeline structure, row-level security that mirrors the org chart, and an ownership model for every governed dataset. Enterprise reporting system design consulting engagements at i3solutions typically range from approximately $180,000 to $750,000 for the full three-phase engagement, with the range driven by five factors. The license line is usually the smallest number on that page, and the one that gets all the attention.
Before Power BI or Tableau draws a single chart, an enterprise usually has to settle where its numbers come from, because Azure SQL tables, Dynamics extracts and departmental spreadsheets often hold three different counts of the same customer, and choosing that shared source layer is the starting decision for an enterprise analytics foundation.
The value of the decision shows up operationally, not in the tool demo. On a nuclear power operator, i3solutions replaced a manual reporting process with an automated dashboard that saved over $293,000 a year and, more importantly for the control environment, removed the manual reconciliation that had been the audit exposure. Custom Power BI dashboard development engagements at regulated enterprises typically range from $80,000 to $150,000 for a bounded project covering a single business area with a stable data source register, and from $300,000 to $750,000 for a multi-wave program covering enterprise-scale analytics capability with full governance, compliance evidence chains, and adoption work across multiple business units. Those numbers, from our custom Power BI dashboard development practice, are what the reporting decision actually costs and returns when it is treated as an operating capability rather than a software purchase. After the tool choice, the next question is which firms lead analytics and reporting for regulated enterprises.
We start from the audience, because that is where the money and the risk both live: who consumes reports, how many of them there are, what they consume on, and what a regulator will one day ask about access. Then we model three-year license cost under your real headcounts, the governance requirements your compliance regime imposes, and the migration effort if an incumbent estate has to move. i3solutions is a Microsoft Solutions Partner, and we will still tell you when Tableau is the right answer, because a recommendation you can trust on the day it favors the rival is the only kind worth paying for. Teams that already know the direction and need delivery capacity can hire Power BI developers from us directly, or start with the executive-trust problem itself through our business intelligence executives can trust engagement.
At wide audiences, yes, and it is checkable arithmetic. Tableau Cloud viewers list at $15.00 per user per month on Standard and $35.00 on Enterprise; Power BI Pro is $14.00, and a Fabric F64 capacity at roughly $8,410 per month replaces viewer licensing entirely. At 3,000 viewers that is $105,000 per month on Tableau Enterprise against a flat capacity fee plus author licenses on Power BI. For small analyst-only deployments the gap narrows, and Tableau’s Creator tier can be competitive with Premium Per User workflows.
At F64 and above. Below that threshold, every viewer needs a Pro license at $14.00 per user per month. At F64, report consumption is covered by the capacity, and only content authors still need per-user licenses. The crossover point arrives around 600 always-on viewers at list prices, and far earlier once a reserved capacity discount of roughly 41 percent is applied, so any organization with over a thousand report consumers should model the capacity route first.
When a seasoned Tableau analyst team and a large curated workbook estate already exist, when the operational core of the business is Salesforce rather than Microsoft, or when the enterprise deliberately keeps its BI layer neutral across clouds and vendors. In those situations the license premium buys real value, and a forced migration to Power BI can cost more in rebuilt content and lost analyst productivity than it saves in subscriptions.
You can, and many enterprises do during a transition, but an indefinite dual estate needs a boundary. Give one platform ownership of governed enterprise reporting and the other a named constituency, a bounded scope, and a review date. Otherwise you pay twice for licenses, twice for semantic modeling, and eventually once more for the meeting where two executives bring two different versions of the same number.
Custom Power BI dashboard development at regulated enterprises typically runs $80,000 to $150,000 for a bounded, single-business-area project with a stable data source register, and $300,000 to $750,000 for a multi-wave enterprise program with full governance and compliance evidence chains. Full enterprise reporting system design engagements range from approximately $180,000 to $750,000. Licensing is additional and comparatively small: the platform work, not the subscription, is where reporting programs succeed or fail.
As an audience-first cost and governance model, not a feature bake-off: your real viewer and author counts priced on both vendors’ published lists over three years, your compliance regime’s access and audit requirements tested against each platform’s controls, and the migration effort priced honestly if an incumbent estate must move. The deliverable is a written recommendation you can hand to a steering committee, including when the answer is Tableau.

US-Based | Est. 1997
© i3solutions. All rights reserved.
US-Based | Est. 1997
© i3solutions. All rights reserved.


