

Plant status and production reporting were assembled by hand for a nuclear generating station’s ownership partners.
The client is a nuclear power plant operator that manages a large nuclear generating station in the United States. The operator runs the facility on behalf of multiple ownership groups, ensuring efficient and reliable energy production. That arrangement makes reporting part of the operating obligation: as part of its responsibilities, the operator must provide accurate, real-time operational updates and future production forecasts to its ownership partners to help them optimize decision-making and revenue generation. The people who need the plant’s numbers most are not the people standing next to it.
The operator’s existing process for delivering this information was highly manual, time-consuming, and prone to errors. The labor-intensive reporting relied on paper documentation and human input, creating inefficiencies and risks of inaccurate or delayed information. With limited real-time visibility into plant operations and forecasts, the ownership groups faced potential financial losses and missed optimization opportunities. To address these challenges, the operator needed an automated, web-based system capable of providing secure, real-time updates and operational insights.
A nuclear plant operator’s ownership partners depended on hand-assembled paper reports for the production data they needed to make decisions. i3solutions replaced that manual cycle with a real-time executive dashboard, saving more than $293,000 a year and paying for itself in three months.
Automating data collection and report generation saves the plant more than $293,000 a year, paid for itself within three months, and gives ownership partners secure 24/7 access to operational data and reports from any location.

The Numbers the Owners Decide On Were Assembled by Hand
The operator’s position is unusual. It runs the facility, but the people who most need what the facility produces in data are the ownership groups it runs the facility for. Accurate, real-time operational updates and future production forecasts are how those partners optimize decision-making and revenue generation, which makes reporting an operating function rather than an administrative courtesy. Delivering it on paper, with every figure passing through a person on the way, put a manual step between plant reality and every decision made on it.
That manual step was expensive in two directions at once. It was slow and prone to errors, creating the risk of inaccurate or delayed information reaching the partners, and it left those partners with limited real-time visibility into plant operations and forecasts, so they faced potential financial losses and missed optimization opportunities. The operator’s conclusion was that the answer was an automated, web-based system capable of providing secure, real-time updates and operational insights, not a faster version of the same paperwork.
This plant operator’s hand-assembled reporting cycle cost enough that the replacement system paid for itself quickly. If your own reporting cycle is still manual, it’s worth pricing out what the delay itself is costing you.
Decisions Made on Yesterday’s Numbers
Left manual, the reporting cycle set the pace of every decision downstream of it. The process ran on paper, and every number in it had passed through a person, so the accuracy of what ownership partners received depended on how many hands had touched it, and its timeliness depended on where it sat in the cycle. Inaccurate or delayed information is not a reporting problem for an owner. It is the input to a revenue decision.
The cost of that landed on the partners’ side of the relationship. With limited real-time visibility into plant operations and forecasts, the ownership groups faced potential financial losses and missed optimization opportunities: production they could not see in time to act on, and operational choices they could not weigh while the window was open. The administrative overhead inside the operator was the smaller half of the problem.
Secure by Default, Reachable From Anywhere, Around the Clock
The system had to serve users in more than one organization without loosening control of the data. Access runs through a sign-on process restricted to selected users, which protects data integrity and keeps information sharing secure, and the same platform has to be reachable from any location, 24 hours a day, 7 days a week, because ownership partners are neither on the plant’s site nor on its schedule. Secure and remote had to be true at the same time, and the operator’s requirement said so in one phrase: an automated, web-based system capable of providing secure, real-time updates.
Replacing a manual cycle means the platform has to carry real-time data feeds and system-generated reports rather than transcriptions of them, across every stream the dashboard reports. Emergent situations set the hardest requirement. An alert about one has to reach the people who need it immediately, which means the notification has to fire without a person in the loop deciding to send it.
A Custom Application Team for Round-the-Clock Operational Reporting
The requirements defined the profile of the team that could meet them. This was full-lifecycle custom application development rather than product configuration: a secure, web-based platform fed by live operational data rather than by transcription, with automated alerts and notifications, sign-on access limited to selected users, and 24/7 remote availability for people outside the operating company. It also had to earn its place financially, because the reporting process it would replace was spread across the people who performed it rather than carried on a line item anyone owned.
The operator engaged i3solutions, which designed and implemented the Executive Dashboard as a secure, web-based custom application. The engagement covered the full span of the problem, from the live feeds behind the numbers through the sign-on process that governs who reads them, and it was measured on the operator’s terms: yearly savings of more than $293,000, with the investment reaching a 100% return within three months of implementation.
i3solutions designed and implemented an Executive Dashboard solution: one secure, web-based platform delivering real-time updates on critical plant status, daily power production, emergent notifications, and 7-day forecasts to the operator’s ownership partners.
PHASE 01
Reporting Process and Data Assessment
i3solutions worked through how operational reporting actually ran: which information the ownership groups needed for decision-making and revenue generation, where the plant status, daily production, and forecast numbers originated, and which steps of the existing cycle depended on paper and manual entry. The assessment defined what the dashboard had to report and which manual interactions it had to remove.
PHASE 02
Dashboard Platform Design
The solution was architected as a web-based platform carrying all four reporting streams live rather than on a cycle. A sign-on process restricting access to selected users was part of the design rather than an addition to it, so data integrity and secure information sharing were properties of the platform from the start.
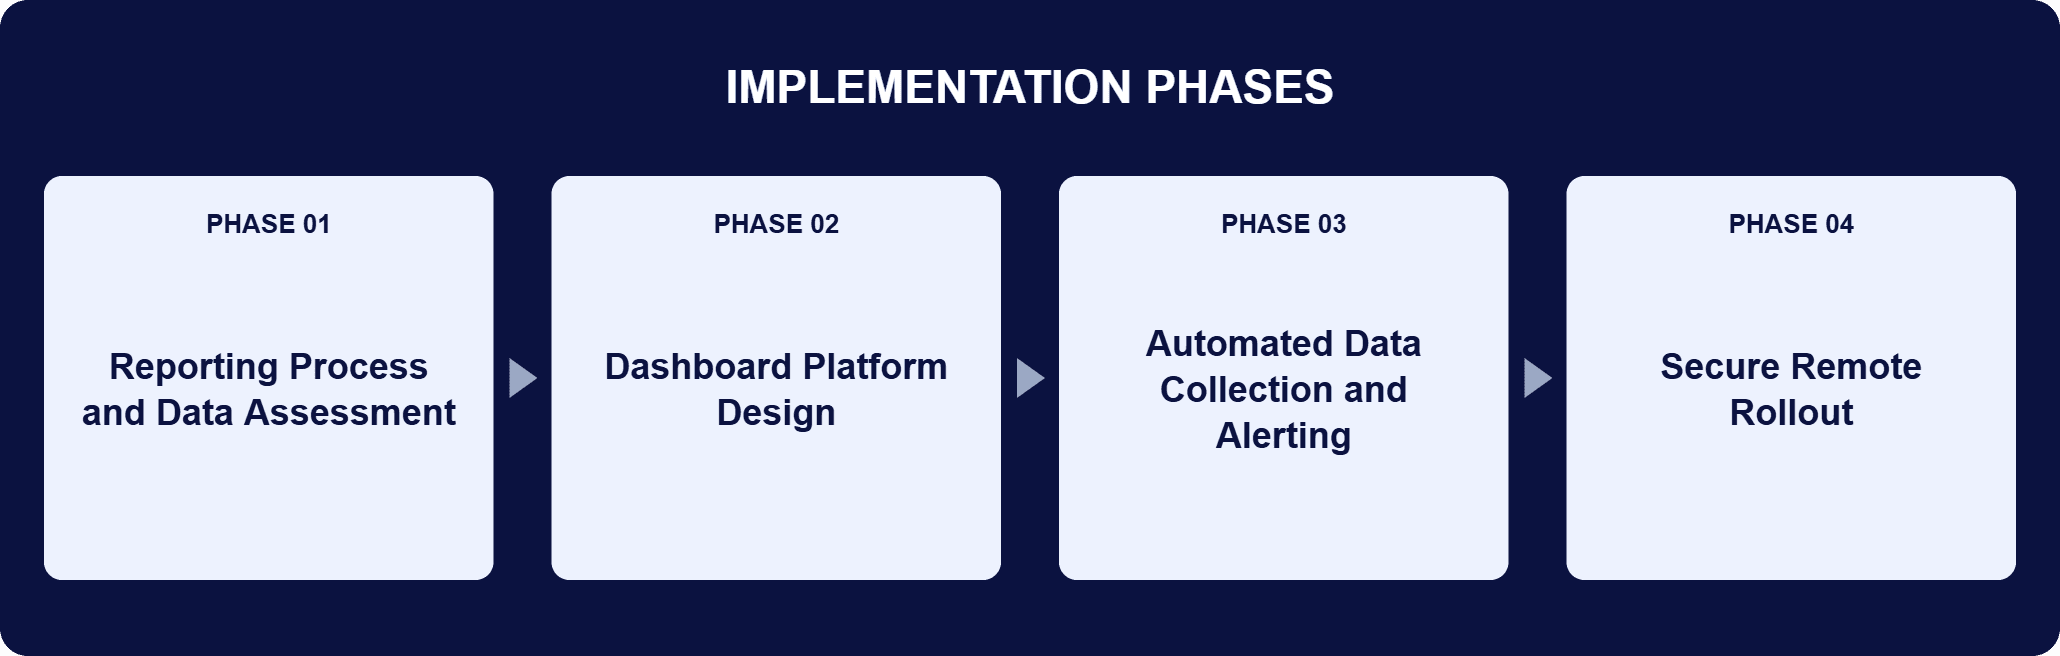
PHASE 03
Automated Data Collection and Alerting
Automated data collection and dissemination replaced the manual reporting process, driven by real-time data feeds and system-generated reports. Automated alerts and notifications were built in, including notifications for emergent situations, so critical events reach ownership partners immediately and can be responded to immediately, instead of waiting for the next reporting cycle.
PHASE 04
Secure Remote Rollout
Selected users were given secure access from any location, 24/7, so ownership partners could view operational updates and forecasts without depending on the operator’s reporting schedule. With collection, system-generated messages, and notifications automated, most manual interactions were eliminated, and the errors and delays they carried went with them.
The Executive Dashboard is a secure, web-based custom application, and its defining design choice is where the data comes from. It runs on real-time data feeds and system-generated reports rather than the paper documentation and human input the previous reporting cycle depended on, so what a partner reads is the plant’s current state and not a transcription of it. Four reporting streams sit on that foundation: critical plant status, daily power production, emergent notifications, and 7-day production forecasts. Notification is automated rather than requested. Alerts fire on their own, including for emergent situations, which is what lets ownership partners respond immediately to a critical event instead of waiting for the next report. Access is deliberately narrow and deliberately available at once. A sign-on process limits the platform to selected users and protects data integrity and secure information sharing, while remote access makes the same view reachable from any location, 24 hours a day. Together those choices eliminate most manual interactions from the reporting cycle, and with them the human error, the inaccuracy, and the delay the manual process produced.

$293,000 Saved, 100% ROI in 3 Months
A secure executive dashboard now delivers daily production, emergent notifications, and 7-day forecasts automatically, around the clock.
| Outcome | Before | After |
|---|---|---|
| Cost of operational reporting | A reporting process assembled by hand | Yearly savings of more than $293,000, with 100% return on investment within three months of implementation |
| Reporting method | Paper documentation and human input | Real-time dashboard portal fed by automated data collection and system-generated reports |
| Administrative overhead | A time-consuming manual reporting process | Drastically reduced administrative overhead |
| Accuracy | Errors and delays produced by manual interactions | Most manual interactions eliminated by automating data collection, system-generated messages, and notifications |
| Ownership partner access | Limited real-time visibility into plant operations and forecasts | Secure 24/7 access to operational data and reports from any location |
| Monthly energy sales | Decisions made without real-time production updates | Real-time production updates enabling the ownership group to optimize plant operations and increase monthly sales volume |
Yearly savings of more than $293,000, with the investment reaching a 100% return within three months of implementation. The payback is that fast because of where the cost had been sitting: distributed rather than budgeted, spread across the people who assembled the reports by hand. Replacing that process with a real-time dashboard portal drastically reduced the administrative overhead it carried.
Secure 24/7 access to operational data and reports lets the ownership partners make informed decisions from anywhere rather than waiting on a cycle they do not control, and real-time energy production updates let the ownership group optimize plant operations and increase monthly sales volume. Accuracy improved through the same mechanism as the savings: automating data collection, system-generated messages, and notifications eliminated most manual interactions, and the errors those interactions produced went out with the paperwork.

PENDING-CLIENT-QUOTE
This engagement is relevant for
Less relevant for
Operational Reporting Off Paper and onto a Secure, Real-Time Portal
The engagement established that the cost of a manual reporting cycle can be large enough to pay for the system that replaces it, and pay for it quickly. A secure, web-based Executive Dashboard running on live operational feeds replaced the hand-assembled reporting cycle for plant status, production, notifications, and forecasts.
Selected users reach it through a sign-on process from any location, 24/7, and automated alerts, including notifications for emergent situations, arrive without anyone deciding to send them. The result was yearly savings of more than $293,000, a 100% return on investment within three months of implementation, and ownership partners able to optimize plant operations and increase monthly sales volume from numbers that are current when they read them.
Yes. The Executive Dashboard was built specifically for stakeholders outside the operating company, with per-user, role-based access so each viewer sees only what they’re authorized to see, replacing a manual reporting cycle that had been assembled by hand for distribution to owners and partners. That’s what let this nuclear plant operator give outside stakeholders real-time visibility without giving up control over who sees what.
The starting question is not what a dashboard should display but what the manual cycle currently costs and where its numbers already live. In this engagement, i3solutions worked backwards from the operator’s obligation: the ownership groups needed accurate, real-time operational updates and future production forecasts, so the platform was built to deliver those directly from the plant’s own live feeds and system-generated reports rather than to speed up the paperwork behind them. Automated data collection and dissemination replaced the manual process. Automated alerts and notifications, including notifications for emergent situations, were built in so critical events do not wait for a reporting cycle. And a sign-on process restricted the platform to selected users, so data integrity and secure information sharing held while remote access opened the same view to partners anywhere, 24/7.
Real-time critical plant status, daily power production, emergent notifications, and 7-day production forecasts, delivered through a web-based portal. It also sends automated alerts and notifications, including notifications for emergent situations, so ownership partners can respond immediately to critical events instead of waiting for the next report. Those streams cover both halves of what the ownership groups need from the operator: what the plant is doing now, in status and daily output, and what it is expected to do next, in the seven-day forecast. Because the reporting is continuous rather than periodic, the partners work from the same current operational picture, at the time they need it rather than at the time a report happens to be issued.
A highly manual, labor-intensive reporting process that relied on paper documentation and human input, and that was slow and prone to errors. Automated data collection and dissemination now do that work, which cut administrative overhead and removed the risk of inaccurate or delayed information reaching the ownership groups. The replacement is not a digitized version of the old cycle. The dashboard runs on real-time data feeds and system-generated reports, so the manual interactions that used to produce the report are eliminated rather than moved online, and the errors and delays they carried are eliminated with them. The automation covers the system-generated messages and notifications the process previously produced by hand as well as the data collection itself.
Savings of more than $293,000 a year, plus a 100% return on investment within three months of implementation. The dashboard also delivers real-time energy production updates, which let the ownership group optimize plant operations and increase monthly sales volume. The speed of the payback follows from where the savings came from. The replaced process was manual and recurring, so its cost sat in effort repeated every cycle rather than in a one-time expense, and removing it returns value on every reporting cycle rather than once. The revenue side compounds that. Real-time visibility into production lets the ownership group act on what the plant is doing while the opportunity is still open, which is exactly the optimization the manual cycle used to cost them.
Only selected users, through a sign-on process that protects data integrity and keeps information sharing secure. Access is remote and available 24/7, so ownership partners can review operational updates and forecasts from any location. The two properties were requirements of the same system rather than a trade-off between them: the operator needed an automated, web-based system capable of providing secure, real-time updates, and both halves of “secure, real-time” had to hold at once. That matters here because the operator is sharing operational data outside its own organization, with multiple ownership groups, so the platform had to make the data reachable to the right people without making it generally available.
Because the ownership groups use the operator’s numbers to optimize decision-making and revenue generation, so the age of the numbers sets the quality of the decision. With limited real-time visibility into plant operations and forecasts, the ownership groups faced potential financial losses and missed optimization opportunities: information arrived on the reporting cycle’s schedule rather than on the decision’s. The outcome of the engagement shows the other side of it. With real-time energy production updates in front of them, the ownership group could optimize plant operations and increase monthly sales volume. The forecast matters as much as the current reading. A 7-day production forecast is a planning horizon, and a planning horizon that arrives late is one you have already spent part of.
A secure, always-on dashboard is what turned a recurring cost into a one-time investment for this operator. We can talk through what a comparable dashboard would look like for your reporting cycle.

US-Based | Est. 1997
© i3solutions. All rights reserved.
US-Based | Est. 1997
© i3solutions. All rights reserved.


