

Legacy tools couldn’t ingest or interpret publicly accessible information at the scale of hundreds of thousands of sources.
The client is a US Department of Defense analytic center that provides information, tools, and support to the US military and other Department of Defense (DoD) components, as well as federal agencies and international partners. Its mandate is collecting, analyzing, and disseminating intelligence to support military operations, mission planning, and decision making. Much of the evidence that work depends on is already public: news articles, files, documents, and both public and private databases carry the record of what competitors, adversaries, and partners are doing. The center could reach that record. Reading it at Big Data volume was the part its technology could not do, and that is where this engagement started.
The center and other key decision makers faced challenges in effectively integrating Publicly Accessible Information (PAI), Artificial Intelligence (AI), and Natural Language Processing (NLP) with cognitive technologies to analyze threats and regional security cooperation environments. Their legacy technologies lacked the capability to efficiently ingest and interpret Publicly Accessible Information as Big Data. Specifically, US military planners and decision makers lacked a tool to evaluate the critical characteristics of adversarial activities using open source information. The ability to compile and analyze available information, thereby bolstering operational planning to counter such activities, was deemed indispensable for strategic planning.
A DoD analytic center’s legacy tools couldn’t ingest or interpret open-source intelligence at the scale modern analysis requires. i3solutions built a real-time ISR platform where more than 20 machine learning models turn that data into displays analysts can act on immediately.
More than 20 machine learning models now gather and organize publicly available information from hundreds of thousands of sources, feeding near-real-time analysis that includes NLP sentiment analysis, language translation, and a calculated stability index for the countries analysts track.

The Open Record Kept Growing and Nothing Could Read It at Scale
The center’s problem was not access to information. It was throughput. Publicly Accessible Information arrives as Big Data, spread across news articles, files, documents, and both public and private databases, in more languages and at more volume than an analytic staff can work through by reading. Legacy technologies lacked the capability to ingest and interpret it efficiently, so the volume that should have been an advantage sat outside the analytic process.
What planners needed from that record was specific: the critical characteristics of adversarial activities, evaluated from open source information, in time to shape operational planning against them. That is a modeling and integration requirement, not a staffing one, and the center treated it that way. Compiling and analyzing the available information, thereby bolstering operational planning to counter adversarial activity, was deemed indispensable for strategic planning.
More than 20 machine learning models now organize information that used to sit as an unusable backlog for this analytic center. If your organization has a similar volume of open-source or unstructured information going unused, the same approach applies.
Planning Against Adversaries Without Reading What Is Already Public
Left unsolved, the gap has a directional cost. The center’s role is to collect, analyze, and disseminate intelligence supporting military operations, mission planning, and decision making, and the fastest-moving part of the evidence base for that work is open. Without a way to ingest and interpret Publicly Accessible Information as Big Data, assessments of threats and of regional security cooperation environments are built on the fraction of the record that happens to be readable by hand.
Timing is the other cost. Near real time Intelligence, Surveillance and Reconnaissance is what makes rapid response to emerging threats possible, and it is what turns situational awareness into operational effectiveness. Analysis that arrives after the fact still describes the civil environment accurately; it just describes it too late to detect, observe, analyze, and assess in time to act. For work aimed at bringing stability to partnered nations while exploiting weaknesses in competitors and adversaries, late is close to unused.
Big Data Volume, Many Languages, and a Spatial Question Underneath
Three constraints shaped the build at once. The first is volume: the models had to gather and organize information sourced from hundreds of thousands of news articles, files, documents, and both public and private databases, which rules out any approach that depends on human triage as the first filter. The second is language: usable output required sentiment analysis, language translation, and frequency analysis together, because a stability index for various countries cannot be calculated from English-only, unweighted text.
The third constraint is that the answers are geographic and relational at the same time. The center needed to see spatial relationships and entity relationships in the same picture, which is why the system pairs graph analytics with geospatial analytics rather than choosing between them. Layered over all three was the requirement that the analysis stay anchored: with a corpus this large, retrieved evidence has to remain tied to the most pertinent source material so the output does not drift into unsupported synthesis.
A Builder That Could Put Machine Learning, Graph, and Geospatial in One System
The requirements defined an unusual vendor profile. The work needed machine learning and Natural Language Processing depth to build and train the collection and modeling layer; generative AI and Large Language Model experience to read a large textual corpus and simulate potential threat scenarios; database engineering across both document and graph stores; and genuine Esri geospatial capability, because the outputs are maps, link charts, and interactive narratives rather than reports. Very few teams carry all four, and splitting them across vendors would have put the integration risk on the center.
The center engaged i3solutions, and the engagement record shows the profile held: over 20 machine learning models built and trained for the system, and the first ever deployment of ArcGIS Knowledge within the Department of Defense (DoD).
i3solutions developed an international security assessment and analytics prototype for Intelligence, Surveillance and Reconnaissance: one system that bridges the gap between the overwhelming volume of Publicly Accessible Information and actionable intelligence, providing near real time ISR to detect, observe, analyze, and assess the civil environment.
PHASE 01
Data Collection, Feature Extraction, and Model Training
i3solutions built the system’s data collection, feature extraction, and visualization layer, developing and training over 20 machine learning models. These models are designed to gather and organize information sourced from hundreds of thousands of news articles, files, documents, and both public and private databases, which puts the first filter on the models instead of on analysts.
PHASE 02
Language Modeling and Stability Indexing
Various NLP tools then perform the sentiment analysis, language translation, and frequency analysis needed to calculate the stability index of various countries. The NLP layer covers text classification, sentiment analysis, machine translation, named entity recognition, and question answering to create country stability indexes for the center, while Retrieval Augmented Generation sifts through the PAI corpus, retrieving relevant information and transforming it into coherent, analytical insights so the analysis stays anchored in the most pertinent data.
When the security reviewers who must approve a retrieval augmented generation pilot want to see which source document stands behind every reply, and proof that it never surfaces a file the user lacks permission to open, an IT team can ask whether custom generative AI services would see the pilot through that review before it goes any further.
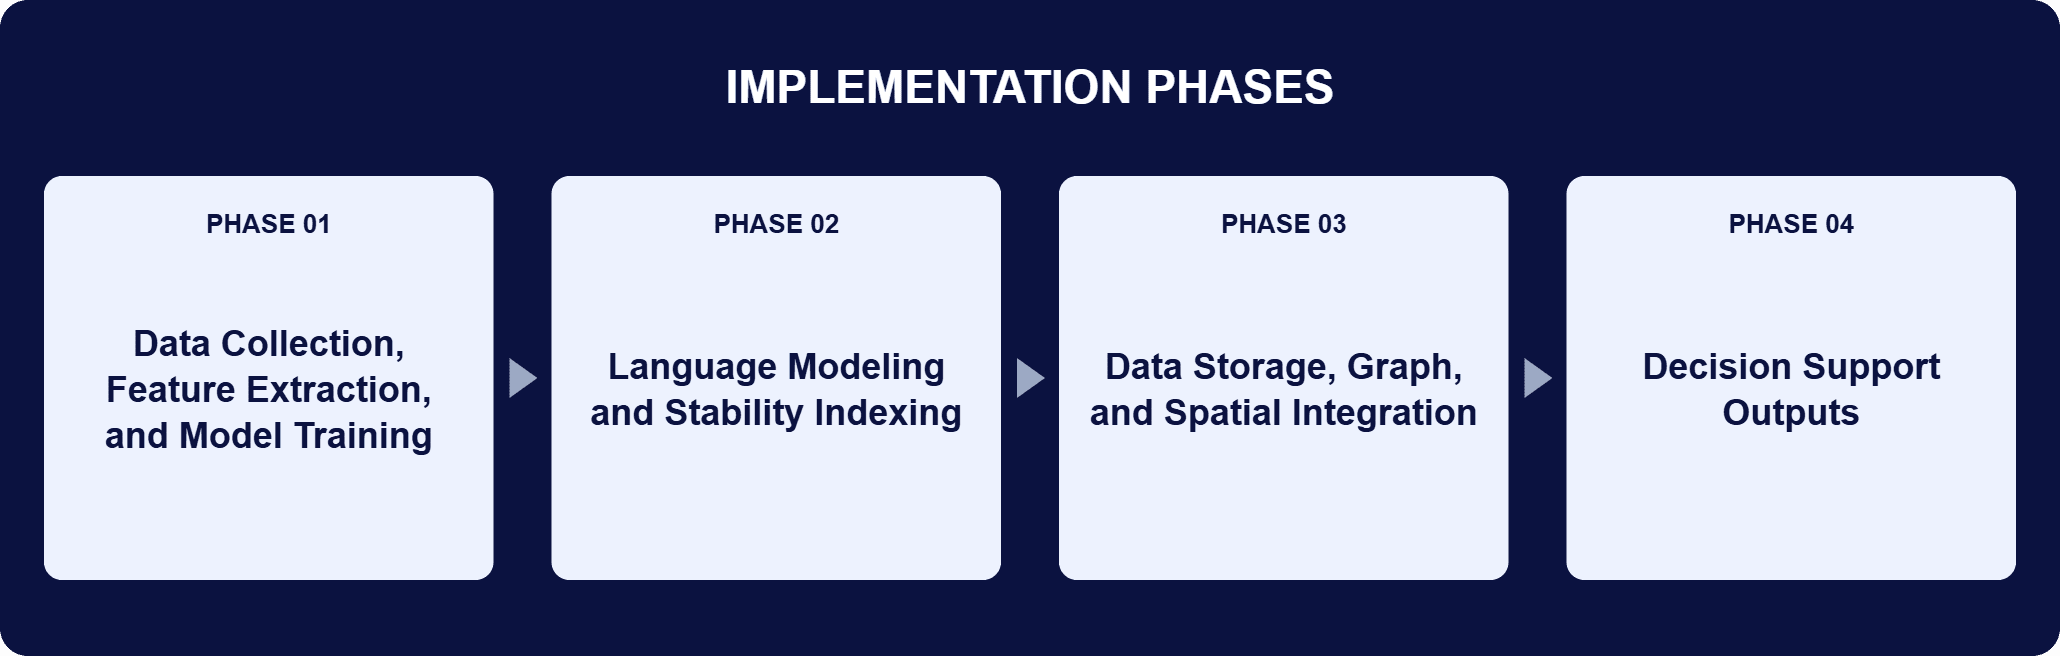
PHASE 03
Data Storage, Graph, and Spatial Integration
MongoDB stores data in flexible, schema-less documents and serves as the central repository for the overall data catalogue and tabular data formats, including CSV files. Neo4j, a highly scalable native graph database management system, stores, retrieves, and manages graph-based data, and combined with ArcGIS Knowledge it lets the center dissect information and establish entity relationships across seemingly disparate data sources.
PHASE 04
Decision Support Outputs
The system’s decision support outputs are geospatial displays, timelines, network graphs, question and answer search, and baseball cards that integrate multiple data sources into a unified display. Esri ArcGIS Pro creates the dynamic maps and visualizations behind that spatial insight and supports in-depth link chart analysis and relationship modeling, and ArcGIS StoryMaps weaves narratives through interactive visualizations of country-level stability indicators.
The prototype moves Publicly Accessible Information from raw volume to decision support in one pass. Over 20 machine learning models, built and trained by i3solutions, collect and collate information from hundreds of thousands of sources, and the Natural Language Processing layer performs sentiment analysis, language translation, and frequency analysis to calculate the stability index of various countries. Generative AI and Large Language Models work above that layer: generative AI simulates potential threat scenarios, providing the center with foresight into future challenges, while LLMs extract meaning from the textual corpus, and Retrieval Augmented Generation keeps the resulting analysis anchored in the most pertinent source material. Storage is split by shape rather than forced into one engine. MongoDB holds the overall data catalogue and tabular formats such as CSV in flexible, schema-less documents; Neo4j manages the graph-based data. Esri ArcGIS Knowledge then integrates graph and spatial analytics to support data discovery, collaborative investigations, link analysis, and information sharing, with ArcGIS Pro producing dynamic maps and link chart analysis and ArcGIS StoryMaps carrying the country-level stability narrative.

Near-Real-Time Intelligence From Open Sources
More than 20 machine learning models now gather and organize open-source intelligence for detection and analysis that wasn’t possible before.
| Outcome | Before | After |
|---|---|---|
| Publicly Accessible Information | Legacy technologies could not efficiently ingest and interpret PAI as Big Data | Over 20 machine learning models gathering and organizing PAI from hundreds of thousands of sources |
| Adversarial activity analysis | No tool to evaluate the critical characteristics of adversarial activities from open source information | Near real time ISR to detect, observe, analyze, and assess the civil environment |
| Country stability assessment | PAI, AI, and NLP not integrated with cognitive technologies | NLP sentiment analysis, language translation, and frequency analysis calculating the stability index of various countries |
| Analyst outputs | Multiple data sources read separately | Geospatial displays, timelines, network graphs, question and answer search, and baseball cards combining multiple sources in one display |
| Graph and spatial analytics | Relationships between entities not established across disparate sources | ArcGIS Knowledge with Neo4j, the first ever deployment of ArcGIS Knowledge within the DoD |
The center’s assessment capability changes shape first. By enhancing assessment capabilities, the system gives it a clearer understanding of the dynamics, capabilities, and intentions of rival Great Powers, so it can anticipate potential challenges, capitalize on emerging opportunities, and shape its policies and responses. The comparative instrument behind that is concrete: a stability index per country, calculated by NLP sentiment analysis, language translation, and frequency analysis over the ingested corpus. Artificial intelligence and machine learning algorithms process and analyze complex data sets rapidly, which is how analysts identify patterns, correlations, and emerging trends that traditional methods leave buried, and generative AI simulates potential threat scenarios so a scenario can be read before it happens.
Delivery changed as much as analysis. i3solutions’ intervention led to significant advancements in geospatial analysis using Esri’s tools, and the specific artifacts are the point: ArcGIS Pro produces the dynamic maps and the in-depth link chart analysis, ArcGIS StoryMaps carries the country-level stability indicators as interactive narratives, and ArcGIS Knowledge holds the graph and spatial layers together, so spatial relationships and patterns are visible and geographical insight applies directly to resource allocation and risk assessment. The system aggregates and synthesizes data from many sources through advanced LLM use, transforming raw textual data into actionable intelligence and surfacing insights and trends that were previously hidden, which improves both operational efficiency and agility. It also provides real-time monitoring of key developments and events related to Great Power Competition, so a shift in the open record reaches the center as a geospatial display, a timeline, or a network graph while there is still time to act on it.

PENDING-CLIENT-QUOTE
This engagement is relevant for
Less relevant for
Publicly Accessible Information Turned into Near Real Time ISR, in One System
The engagement established that the open record can be made into an analytic asset rather than a backlog. Over 20 machine learning models, built and trained by i3solutions, gather and organize information from hundreds of thousands of news articles, files, documents, and both public and private databases, and Natural Language Processing turns that material into sentiment, translation, and frequency analysis behind country stability indexes.
Generative AI, Large Language Models, and Retrieval Augmented Generation read the corpus and keep the analysis anchored to its most pertinent sources. MongoDB and Neo4j hold the catalogue and the graph, and Esri ArcGIS Knowledge, ArcGIS Pro, and ArcGIS StoryMaps put the result in front of analysts as geospatial displays, timelines, network graphs, question and answer search, and baseball cards. Along the way the engagement produced the first ever deployment of ArcGIS Knowledge within the Department of Defense.
A prototype system that ingests Publicly Accessible Information as Big Data and returns near real time Intelligence, Surveillance and Reconnaissance so the center can detect, observe, analyze, and assess the civil environment. Its outputs include geospatial displays, timelines, network graphs, question and answer search, and “baseball cards” that pull multiple data sources into a single display. It is an international security assessment and analytics capability in its own right: machine learning, Natural Language Processing, geospatial analysis, and statistical modeling run in one system, so the overwhelming volume of Publicly Accessible Information becomes something an analyst can act on. The near real time part is what makes it operational, because it supports rapid response to emerging threats rather than description after the fact.
Over 20 machine learning models, built and trained by i3solutions, gather and organize information from news articles, files, documents, and both public and private databases. Natural Language Processing tools then run sentiment analysis, language translation, and frequency analysis to calculate the stability index of various countries, and Retrieval Augmented Generation keeps the analysis anchored to the most pertinent source material. The NLP work spans text classification, sentiment analysis, machine translation, named entity recognition, and question answering, which is what makes the country stability indexes possible across a multilingual corpus. Generative AI sits above that layer to simulate potential threat scenarios, and Large Language Models extract meaning from the textual corpus, so deep contextual analysis surfaces hidden patterns and trends inside a large volume of disparate data.
Machine learning and Natural Language Processing for modeling and text analysis; generative AI and Large Language Models for scenario simulation and contextual reading of large text corpora; Retrieval Augmented Generation for source retrieval; MongoDB as the central repository for the data catalogue and tabular formats such as CSV; Neo4j as the graph database; and Esri ArcGIS Knowledge, ArcGIS Pro, and ArcGIS StoryMaps for spatial analytics, link chart analysis, and interactive narratives. Each choice answers a different shape of the problem. MongoDB stores complex data structures in flexible, schema-less documents; Neo4j is a highly scalable native graph database for graph-based data; and ArcGIS Knowledge integrates graph and spatial analytics to support data discovery, collaborative investigations, link analysis, and information sharing.
Yes. The prototype was built for a US Department of Defense analytic center, and the engagement included the first ever deployment of ArcGIS Knowledge within the Department of Defense (DoD). The scope of that delivery is the useful detail. i3solutions developed and trained over 20 machine learning models for the system, built the Natural Language Processing layer behind the country stability indexes, integrated MongoDB and Neo4j as the catalogue and graph stores, and delivered the Esri outputs analysts work from. That is full prototype development inside a defense analytic environment: models, language layer, databases, and geospatial outputs.
In two ways. The first is assessment: by enhancing assessment capabilities, the system gives the center a clearer understanding of the dynamics, capabilities, and intentions of rival Great Powers, so it can anticipate potential challenges, capitalize on emerging opportunities, and shape its policies and responses accordingly. The second is timing: the system provides real-time monitoring of key developments and events related to Great Power Competition, which lets the center react swiftly to emerging threats or opportunities and keeps its decision making agile and adaptive. The country stability indexes produced from sentiment analysis, language translation, and frequency analysis are the comparative layer underneath both, and ArcGIS StoryMaps carries those country-level stability indicators as interactive narratives.
Because the questions are relational and geographic at the same time. Neo4j is a highly scalable native graph database management system designed to store, retrieve, and manage graph-based data, and it is what makes entity relationships first-class rather than a join. Esri ArcGIS Knowledge integrates graph and spatial analytics to support data discovery, collaborative investigations, link analysis, and information sharing, so dissecting information and establishing entity relationships happens in the same environment as the map. Combined, they let the center extract complex relationships from seemingly disparate data sources and pull deeper insight from spatial data using built in tools and libraries for visualization and analytics. ArcGIS Pro then adds dynamic maps and in-depth link chart analysis and relationship modeling on top.
Yes. For this DoD analytic center, i3solutions built a platform that ingests Publicly Accessible Information as Big Data and applies more than 20 machine learning models to it, including the first Department of Defense deployment of ArcGIS Knowledge. Sentiment, translation, and frequency analysis feed country-level stability indexes instead of arriving as separate, disconnected tools, and the outputs are readable as maps, timelines, network graphs, and search results analysts can act on directly.
This engagement produced the first-ever deployment of ArcGIS Knowledge within the Department of Defense. We’re glad to discuss what a comparable capability would take to build in your environment.

US-Based | Est. 1997
© i3solutions. All rights reserved.
US-Based | Est. 1997
© i3solutions. All rights reserved.


