Developing a Shared Vision with Your Customer Using Agile Modeling
Agile is big on collaboration with customers. Using tight feedback loops and active owner involvement, teams employ Agile to develop better software that meets customer needs and expectations. The technicalities of engineering projects can often make it challenging to carry stakeholders along. That’s where Agile modeling comes in to help teams and clients develop a shared vision of the final product.
Using various Agile modeling techniques, teams can express ideas easier and help the customer understand the project better. Consequently, feedback is meaningful and richer, and all parties can completely visualize the expected product.
Agile modeling techniques avoid overly detailed requirements and documentation and instead implement different types of lightweight or “barely-sufficient” models. Agile requirements don’t need to be perfect; they just need to meet the need and create a shared understanding. Here are five common types of Agile models.
1. Wireframes
Wireframes are simple black and white diagrams that demonstrate software layout, placement of elements, and basic functionality. They are characterized by their intentional lack of detail and core mission to provide a step-by-step representation of how features or products will work.
Think of a wireframe like a vehicle’s chassis or skeleton. It’s a stripped-down version of the product that shows how the application will look and function over subsequent stages or actions. Since wireframes demonstrate app design and functionality, they can seem uncomfortably similar to screen design and use case models. There are, however, clear differences.
While screen design focuses on aesthetic elements and page navigation from a user’s perspective, wireframes represent functionality between user actions. In the same vein, use case diagrams are concerned with representing the product’s core proposition from a high-level user perspective, while wireframes provide a granular look into the application’s functions and processes.
Wireframes are valuable tools to communicate the programming roadmap to clients. They’re also a great way for the client to scrutinize functionality and rapidly identify where they think something is missing or needs to be changed. In addition, wireframes constitute blueprints that designers and developers can rely on to create mockups and identify how a series of user interactions should interrelate.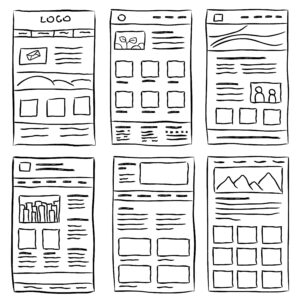
Wireframing may start with a quick sketch on paper to rapidly ideate and visualize page layouts and action sequences. After getting a basic idea of the app interface, the wireframe can then be refined using relevant software tools that bring several advantages, including:
- Seamless iteration and reorganizing of existing sketches
- Representation of typical UI templates such as grids, icons, drop-down menus, and buttons
- Easy collaboration with other team members who can all work on the same file
- Inbuilt capabilities that turn existing wireframes into prototypes
Wireframing perfectly fits Agile projects because it fosters broad team involvement and collaboration even at this early stage. Likewise, it produces a lightweight, consumable representation that users and customers can easily follow. Finally, it sets the basis for an iterative approach, starting with paper sketches that culminate into a usable product.
2. Screen designs
Screen designs are simple drawings or sketches of an application’s proposed user interface. It is related to user interface prototyping that acts as an artifact that helps envision a system or explore an application’s solution space. A screen design is much simpler, though, as it aims to help stakeholders see what the product interface might look like.
Screen drawings are mostly concerned with representing the layout of elements on the display. It maps the location of elements like buttons, navigation, headings, text, icons, and other interactive features. Additionally, the sketch provides a rough representation of page composition and appearance within the interface.
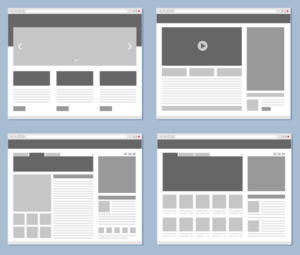 Screen designs are useful for representing interface appearance in applications, mobile devices, and websites. The team will consider the varying format requirements for screen sizes and device types for at minimum, basically accurate features and interaction patterns.
The design work that happens here is important because it forms the root of eventual interface coding. As a result, screen design should incorporate usability, psychological, and technical factors. After all, user interface design contributes to conversion, as marketing experts note. Although, such considerations should not introduce unnecessary complexity at this initial stage.
It’s worth noting that users are always at the core of the screen design process. That’s why it makes sense to clarify target markets and user identity before sketching. For instance, displays for children will naturally be different from interfaces meant for adults. At the same time, client style or technical preferences may also play a role, which is why some experts recommend creating a simplified style guide based on the complete discussions that follow a screen design. The style guide will include:
- Screen template specifications
- General layout structure
- Page architecture
- Definition of formats for dates, addresses, numbers
- Typographic concept, including fonts, text layouts, etc.
- Design pattern
- Color scheme
Overall, a screen design allows the client to visualize what the interface might look like, and this will form the basis of coding expectations that follow.
3. Data models
Data models help teams communicate how data will be stored in an application and the modeling relationships within that data. Like use case diagrams, data models aim to create a visual resource that explains the data structure and showcases data flow and relationships.
Data modeling typically occurs after requirements modeling, which essentially refers to use cases. While the use case explains what the application will do, data modeling helps explain how those functions will be achieved. Using simple graphical demonstrations, data models describe the data objects (also called entities), their attributes, and their relationships.
While there are many ways that teams create data models, the two most common methods are UML and Entity-Relationship Diagrams (ERD). Ideally, data modeling occurs early on in the app development process. Although, as per Agile principles, the system will be developed incrementally with ample room for course correction as learning and growth occur.
There are three main stages of data modeling: conceptual, logical, and physical. Modeling begins at the high-level conceptual stage and then progresses systematically to physical modeling, which includes detailed representation.
- Conceptual: Conceptual modeling provides an abstract representation of data structure and flow. It
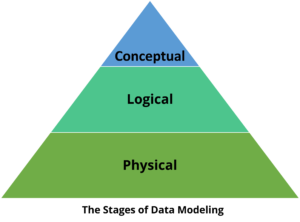 identifies entities and their general relationship but omits the technical details to enable greater stakeholder participation. In this sense, conceptual data models act as a storyboard, painting a broad picture of how the business requirements link to data systems.
 - Logical: Logical modeling goes a step further to define entity attributes and includes more detail on their relationships. The stage also includes the addition of fields/schema and data types for each, assignment of nullability and optionality, and metadata addition. Some teams may choose to omit this stage and instead go straight to physical modeling.
- Physical: Physical models provide the most detail. They show how and where data will be stored, the granular links between data systems, and every other detail necessary for a complete technical schema.
Data models help the customer understand data flow and structure when done correctly without getting bogged down with the details. At the same time, they provide team members with a detailed map of data interactions and a reliable base on which future work can build.
4. Use case flowcharts
A use case diagram is a simple graphical representation of a system’s functionality from the end user’s viewpoint. It visualizes observable interactions between actors and the system using a Unified Modeling Language (UML) but without showing how those interactions will be achieved. Essentially, use case flowcharts visualize a system’s function (what) as a user interacts with it while leaving out the details (how).
Use case diagrams are valuable for collecting requirements because they effectively communicate system behavior in user terms. Likewise, the diagram could help stipulate system context, validate system architecture, or generate test cases to drive implementation.
The components of a use case diagram include:
- Actor: Person who interacts with the system. They trigger use cases and have responsibilities towards the system just as they have expectations from it. Identifying the actor can be the simplest way to begin collecting requirements. Helpful ways to start include asking who uses the system? Who maintains, starts, or shuts it down? Those people are likely to be actors.
- System: This could be the entire application as specified in the requirements or a module within the application.
- Use case: Functionalities within the system or a process that accomplishes an action. Each actor is linked to a use case. However, not all use cases are linked to actors. Identifying use cases can be complicated as well. You can start by asking what functions the actor wants from the system. Will actors create, edit, or delete information in the system?
- Communication link: Denotes participation between elements in the use case diagram.
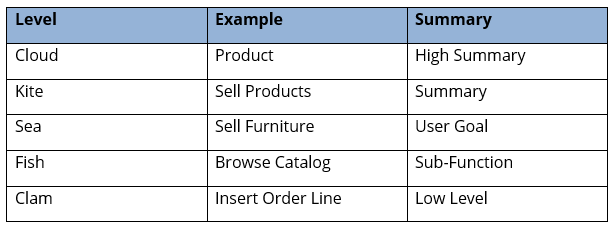
It’s worth noting that the use case diagram is user-centered. As a result, it should always be organized or structured around the actor(s). Additionally, use cases should have low granularity – they should begin at the highest possible view. In his book, Writing Effective Use Cases, Alastair Cockburn uses the following table to visualize different goal levels:
A use case diagram is most valuable when operating as a high-level blueprint. As a result, it should include as little detail as possible unless necessary.
5. Personas
Personas are detailed representations of an application’s ideal user. As the Agile Alliance explains, personas are “synthetic biographies of fictitious users of the future product.” They’re essentially pretend users of a software product, created to guide the team in their choices of features, functionality, interface, experience, etc.
Personas result from the realization that you cannot design or code software for everybody. Software meant to please everyone will end up pleasing no one because you’ll inevitably leave out or include things that people don’t want. Instead, personas refine the development process, giving teams “an anchor for justifying design choices”, according to the Agile Alliance.
 By including personas as part of the team’s shared assumptions, everyone can design and code knowing the consequences of each choice. It becomes easier to determine what features are necessary, where certain functionalities are needed, and how John or Sarah will interact with the product.
Customers typically provide input to help teams create product personas. The user personality will be based on what the client sees as their target user, whose personalities and preferences will determine product design and function. Since products will typically have a broad range of users, teams will naturally develop several personas.
It’s important to state that personas are not user roles – they are not defined by their tasks or job descriptions. Rather, the emphasis with personas is on their goals and behaviors and how that translates into their use of the product. Also, while personas will have demographic attributes, they are not primarily defined in terms of those attributes. The team is concerned with them as product users and not buyers.
When done correctly, any of these Agile modeling techniques are easier and quicker to create than a detailed requirements document. The appropriate Agile model may vary by project, but it is important that they are all done as broad strokes with just the bare minimum of information. These visual representations of the requirements are faster to create and read so you can quickly see the big picture of the project and where it’s going.
Engaging clients with these simple models early in the process gets them thinking about what their needs really are and helps them to define their project goals. Frequent collaboration between team members and the client, using these visual models, will result in actionable feedback and a final shared vision for the project.
Share Your Vision with i3solutions
For 25 years, i3solutions has collaborated closely with our clients to create the perfect vision for their projects. We believe that the success of any project depends first and foremost on the process and design to ensure the final product meets current needs and future expectations. Contact us today to start the conversation of how we can work together to use Agile Modeling to make your vision a reality.
1 Comment
Leave a Comment


Useful Content. Thanks for sharing